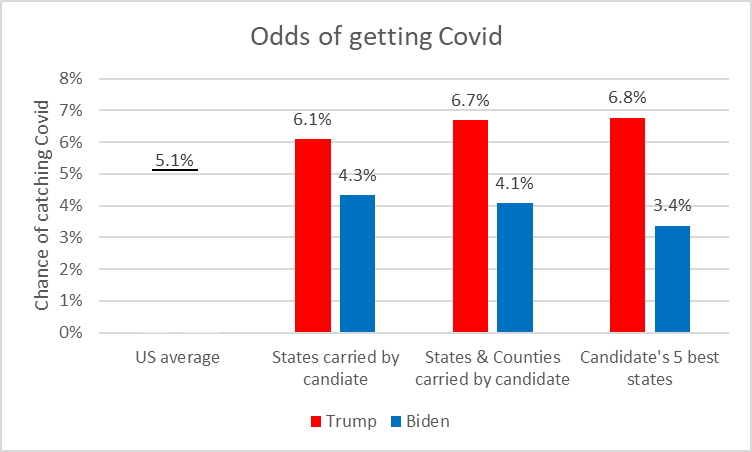
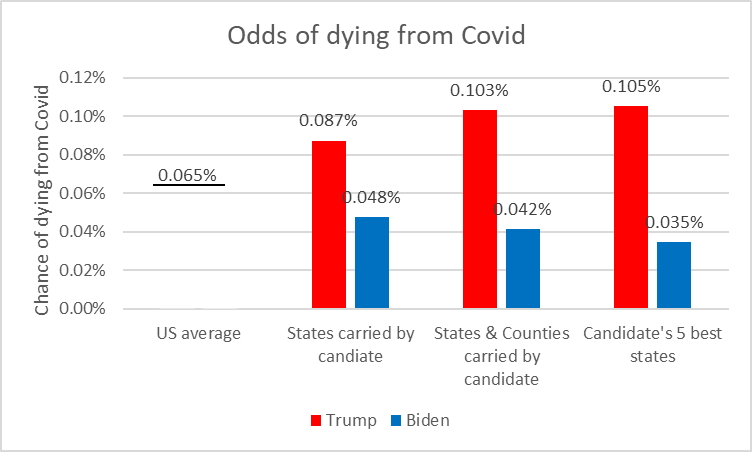
Since May 2021, people living in counties that voted heavily for Donald Trump during the last presidential election have been nearly three times as likely to die from COVID-19 as those who live in areas that went for now-President Biden. That's according to a new analysis by NPR that examines how political polarization and misinformation are driving a significant share of the deaths in the pandemic.
NPR looked at deaths per 100,000 people in roughly 3,000 counties across the U.S. from May 2021, the point at which vaccinations widely became available. People living in counties that went 60% or higher for Trump in November 2020 had 2.73 times the death rates of those that went for Biden. Counties with an even higher share of the vote for Trump saw higher COVID-19 mortality rates.
In October, the reddest tenth of the country saw death rates that were six times higher than the bluest tenth, according to Charles Gaba, an independent health care analyst who's been tracking partisanship trends during the pandemic and helped to review NPR's methodology. Those numbers have dropped slightly in recent weeks, Gaba says: "It's back down to around 5.5 times higher."
The trend was robust, even when controlling for age, which is the primary demographic risk of COVID-19 mortality. The data also reveal a major contributing factor to the death rate difference: The higher the vote share for Trump, the lower the vaccination rate.
The analysis only looked at the geographic location of COVID-19 deaths. The exact political views of each person taken by the disease remains unknowable. But the strength of the association, combined with polling information about vaccination, strongly suggests that Republicans are being disproportionately affected.
Recent polling shows that partisanship is now this single strongest identifying predictor of whether someone is vaccinated. Polling also shows that mistrust in official sources of information and exposure to misinformation, about both COVID-19 and the vaccines, run high among Republicans.
"An unvaccinated person is three times as likely to lean Republican as they are to lean Democrat," says Liz Hamel, vice president of public opinion and survey research at the Kaiser Family Foundation, a nonpartisan health policy think tank that tracks attitudes toward vaccination. Political affiliation is now the strongest indicator of whether someone is vaccinated, she says: "If I wanted to guess if somebody was vaccinated or not and I could only know one thing about them, I would probably ask what their party affiliation is."
It was not always this way. Earlier in the pandemic, many different groups expressed hesitancy toward getting vaccinated. African Americans, younger Americans and rural Americans all had significant portions of their demographic that resisted vaccination. But over time, the vaccination rates in those demographics have risen, while the rate of Republican vaccination against COVID-19 has flatlined at just 59%, according to the latest numbers from Kaiser. By comparison, 91% of Democrats are vaccinated.
Republicans make up a majority of unvaccinated people in the U.S.
Since April, Democrats and independents have made up a declining share of the unvaccinated population, as more of those groups have become vaccinated. Meanwhile, the Republican share of the unvaccinated population has grown.
Being unvaccinated increases the risk of death from COVID-19 dramatically, according to the CDC. The vast majority of deaths since May, around 150,000, have occurred among the unvaccinated, says Peter Hotez, dean for the National School of Tropical Medicine at Baylor College of Medicine.
While vaccine hesitancy exists in many different groups, Hotez suspects that the deaths are "overwhelmingly" concentrated in more politically conservative communities. "How does this make sense at any level?" he asks.
More than 90% of Republicans surveyed believe or are unsure about at least one false statement about COVID-19
The consequences for individuals are real. Mark Valentine still remembers when his brother called him to tell him he had contracted coronavirus. Valentine is a trial consultant in North Carolina. His brother Phil, 61, was a well-known conservative talk show host in Nashville, Tenn., who often expressed skepticism about vaccination.
Neither brother was vaccinated, and neither one was particularly worried about Phil's positive result. His brother said he was trying several alternative therapies commonly promoted in conservative circles. "He said, 'I've got the ivermectin, I started it this morning, and I don't think it's going to be a big deal,' " Mark Valentine recalls. "And frankly I didn't think about it anymore."
But a week later, Mark said he got a call from his brother's wife saying that the two were going to the hospital. "Before I knew it, he was in there and I couldn't get to him, couldn't talk to him," Valentine recalls. "His situation took a nosedive like you can't believe."
Phil Valentine died in August about five weeks after he announced he had tested positive for COVID-19.
Misinformation appears to be a major factor in the lagging vaccination rates. The Kaiser Family Foundation's polling shows Republicans are far more likely to believe false statements about COVID-19 and vaccines. A full 94% of Republicans think one or more false statements about COVID-19 and vaccines might be true, and 46% believe four or more statements might be true. By contrast, only 14% of Democrats believe four or more false statements about the disease.
More than 90% of Republicans surveyed believe or are unsure about at least one false statement about COVID-19
Members of all parties believe that some amount of false statements about COVID-19 are true, but those shares are greatest among Republicans and independents.
Belief in multiple false statements highly correlates with vaccination status, Hamel says. "If you believe that the vaccines can damage your fertility, that they contain a microchip and that the government is inflating the number of COVID-19 deaths, you're going to think really differently about whether to get vaccinated."
The most widely believed false statement was that 'the government is exaggerating' the number of COVID-19 deaths
Perhaps the most pernicious pieces of misinformation have to do with the perceived severity of COVID-19 itself. The most widely believed false statement was: "The government is exaggerating the number of COVID-19 deaths."
Hamel says that underestimating the severity of COVID-19 appears to be a major reason why Republicans in particular have fallen behind in vaccination: "We've seen lower levels of personal worry among Republicans who remain unvaccinated," she says. "That's a real contrast with what we saw in communities of color, where there was a high level of worry about getting sick."
Complacency around the risks of contracting COVID-19 certainly seemed to be a major reason why the Valentine brothers avoided vaccination. While not conspiracy theorists, they were staunch Trump supporters. The arrival of coronavirus just ahead of the presidential election of 2020 seemed like "the most fortuitous pandemic in the history of the world" for the Democratic Party, recalls Mark.
Despite the media coverage, Phil Valentine didn't believe COVID-19 was serious as long as you were healthy: "He said, 'The likelihood of me getting it is low. In the unlikely event that I do get it, the likelihood that I will survive it is 99-plus %,' " Mark Valentine recalls.
Vaccine researcher Peter Hotez is deeply troubled by the current state of affairs. A winter surge in COVID-19 cases is brewing, and the newly discovered omicron variant has the potential to make things far worse.
He thinks the elements of the Republican Party that are endorsing anti-vaccine ideas need to take a big step back. "I'm not trying to change Republican thinking or far-right thinking," he says. "I'm trying to say: 'The anti-science doesn't belong; it doesn't fit. ... Just stop it and save lives.' ''
Before his illness, Phil Valentine had sometimes promoted unproven alternative therapies and taken a mocking tone toward vaccination. As his situation deteriorated, Mark says the talk show host realized he needed to encourage his listeners to get vaccinated. Phil told his brother, "'My fear is that because I didn't get it, other folks may not get it," Mark Valentine recalls. The family put out a statement in support of vaccination, and Mark went on to his brother's talk show to encourage listeners to take the shot.
He also headed to his local Walmart to get vaccinated. "The guy comes out; he said, 'Do you have any questions or concerns?' " Mark Valentine recalls. "I said, 'Hell yeah, I've got both, but do it anyway.' "
RELATED:
Methodology
Vaccination rate data are the rate of vaccination among all people 18 years of age or older, as of Nov. 30. They are from the Centers for Disease Control and Prevention.
COVID-19 deaths per 100,000 residents are calculated by dividing the deaths from COVID-19 in a county since May 1 by the county's population. County population data come from the U.S. Census Bureau's 2020 decennial census. May 1 was chosen as the start date of our analysis because that is roughly the time when vaccines became universally available to adults ages 18 and older. COVID-19 death data is collected by the Center for Systems Science and Engineering (CSSE) at Johns Hopkins University and is current as of Nov. 30. COVID-19 death data for Florida and Utah are from the May 2 and December 1 editions of the COVID-19 Community Profile Report, produced by the White House COVID-19 Team.
2020 election result data are from MIT Election Data and Science Lab.
Alaska does not report election results by county-equivalent area, so it is excluded from the analysis. Nebraska is excluded from the analysis because it does not report county-level COVID-19 statistics. Hawaii is excluded because it does not report county-level vaccine data. Some counties that have reported no COVID-19 deaths since May 1 may have stopped reporting. These counties generally have very small populations and have a negligible impact on the weighted averages. Erring on the side of caution, we include all data unless it is known that they are in error.
All averages are weighted by county population. The overall average represents the average of the 3,011 counties included in the analysis.
Thanks to Emily Gurley, Professor of the Practice and Emily Pond, Research Data Analyst, both of Johns Hopkins Bloomberg School of Public Health for discussions about our methodology.


No comments:
Post a Comment
If you support Trump you deserve cancer.